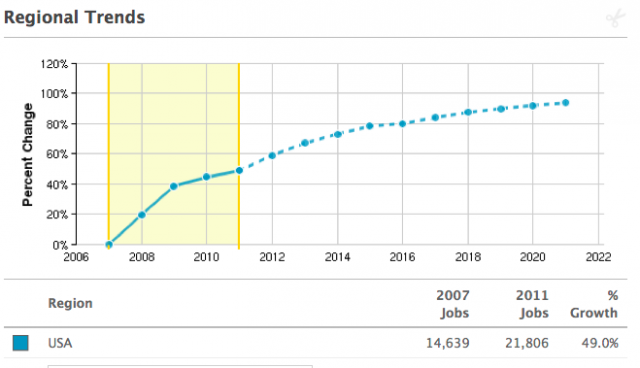
Since 2007, a time when most of the economy was taking a severe beating, translation and interpretation services have grown by about 50%. According to NAICS, this industry (541930) “comprises establishments primarily engaged in translating written material and interpreting speech from one language to another and establishments primarily engaged in providing sign language services.”
Here is an overview:
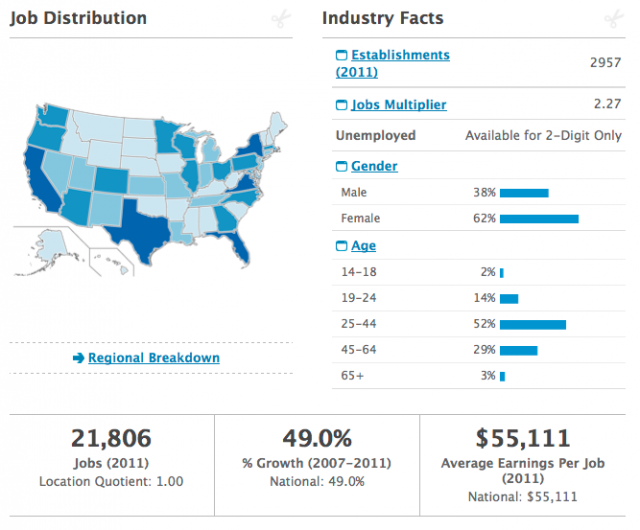
In the U.S. there are currently 3,000 establishments, or places of work, that provide translation services. From 2007 to 2011, the industry created over 7,000 new jobs and now has nearly 22,000 estimated jobs. Over 60% of the people employed in this sector are female and more than 50% are younger workers — between the ages of 25 and 44.
Below is a closer look at some of the top occupations in the translation industry.
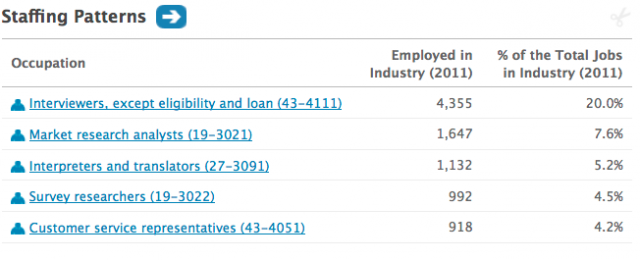
- One in five in the the workforce (over 4,000) are employed as interviewers.
- Survey and market researchers make up another 12% of the industry.
- Interpreters and translators compose over 5% of the industry.
- Customer service also plays an important role in this industry. It is increasingly common to see customer service reps as key parts of industry staffing patterns.
Now, here is a look at where translation services are concentrated.
| State Name | 2007 Jobs | 2011 Jobs | % Change | 2011 Avg. Annual Wage | 2007 National Location Quotient |
|---|---|---|---|---|---|
| Total | 14606 | 21742 | 0.49 | 55170 | |
| California | 2,849 | 4,330 | 52% | $62,342 | 1.69 |
| New York | 1,434 | 1,778 | 24% | $59,306 | 1.57 |
| Texas | 1,177 | 1,776 | 51% | $50,536 | 1.07 |
| Virginia | 538 | 1,312 | 144% | $104,008 | 1.32 |
| Florida | 621 | 1,084 | 75% | $43,778 | 0.73 |
| Colorado | 426 | 710 | 67% | $41,023 | 1.71 |
| North Carolina | 384 | 707 | 84% | $74,344 | 0.86 |
| Maryland | 656 | 676 | 3% | $57,521 | 2.36 |
| Oregon | 409 | 634 | 55% | $42,882 | 2.21 |
| Ohio | 337 | 628 | 86% | $49,014 | 0.59 |
| Illinois | 342 | 611 | 79% | $45,647 | 0.54 |
| Arizona | 310 | 598 | 93% | $40,559 | 1.09 |
| Georgia | 375 | 586 | 56% | $53,515 | 0.84 |
| Washington | 453 | 559 | 23% | $37,706 | 1.42 |
| Massachusetts | 490 | 542 | 11% | $74,783 | 1.42 |
| Pennsylvania | 343 | 517 | 51% | $45,395 | 0.56 |
| Minnesota | 352 | 489 | 39% | $38,746 | 1.21 |
| Wisconsin | 542 | 477 | (12%) | $25,271 | 1.80 |
| Utah | 132 | 422 | 220% | $39,631 | 1.00 |
| Michigan | 327 | 359 | 10% | $48,349 | 0.73 |
| New Jersey | 183 | 290 | 58% | $50,820 | 0.43 |
| Missouri | 231 | 254 | 10% | $37,444 | 0.78 |
| Tennessee | 152 | 244 | 61% | $40,591 | 0.52 |
| Louisiana | 145 | 233 | 61% | $82,543 | 0.71 |
| New Mexico | 228 | 230 | 1% | $23,484 | 2.54 |
| Indiana | 144 | 222 | 54% | $36,088 | 0.46 |
| Kansas | 101 | 200 | 98% | $41,497 | 0.67 |
| Connecticut | 126 | 160 | 27% | $57,890 | 0.70 |
| Nevada | 55 | 132 | 140% | $70,876 | 0.40 |
| District of Columbia | 148 | 109 | (26%) | $63,462 | 2.00 |
| Nebraska | 54 | 108 | 100% | $53,164 | 0.54 |
| Kentucky | 99 | 101 | 2% | $31,614 | 0.50 |
| South Carolina | 48 | 97 | 102% | $40,176 | 0.23 |
| Maine | 56 | 94 | 68% | $38,592 | 0.86 |
| Idaho | 42 | 86 | 105% | $61,974 | 0.58 |
| Iowa | 59 | 59 | 0% | $35,941 | 0.37 |
| Arkansas | 50 | 55 | 10% | $33,422 | 0.39 |
| Hawaii | 34 | 49 | 44% | $57,888 | 0.47 |
| Alabama | 28 | 48 | 71% | $44,808 | 0.13 |
| New Hampshire | 27 | 45 | 67% | $33,780 | 0.40 |
| South Dakota | 18 | 35 | 94% | $36,822 | 0.43 |
| Rhode Island | 25 | 33 | 32% | $39,396 | 0.48 |
| Oklahoma | 27 | 22 | (19%) | $41,177 | 0.16 |
| West Virginia | 17 | 20 | 18% | $38,993 | 0.22 |
| Mississippi | 11 | 19 | 73% | $51,039 | 0.09 |
- When it comes to translation services, California is the clear leader. There are currently 4,330 employed, and 1,500 jobs have been created since 2007, which amounts to 52% growth. In addition, California has a higher per capita concentration (1.69 LQ) of translation services as compared to the average state (1.00 LQ).
- If we consider pure employment, New York, Texas, Virginia, and Florida are the next states on the list. Translation services employ over 1,000 in each state. Virginia grew by 144% since 2007 and has a very high industry earning figure (over $100,000 per year). This is likely related to its proximity to the nation’s capital.
- With location quotients above 2.0, Maryland and Oregon have the highest concentration in translation services.
- Utah has had the fastest percent growth (220% since 2007.
Conclusion
It is always refreshing to see an industry that is thriving, especially during hard times. For more on why this industry is growing, check out this 2009 article from Inc. Magazine.
Welcome to the world of translation services and localization — a multibillion-dollar global market, where companies help bridge the communication gap between clients, businesses and individuals. Many of the high-growth companies on our Inc. 500|5000 list have thrived in this niche area that offers a suite of services from document translation to website localization to multilingual court reporting to oral interpretation.
These companies help bridge the communication gap between clients and businesses worldwide. They understood early on that in a global economy, clear, concise, communication is everything.
For your reference, please refer to original source: EMSI

